
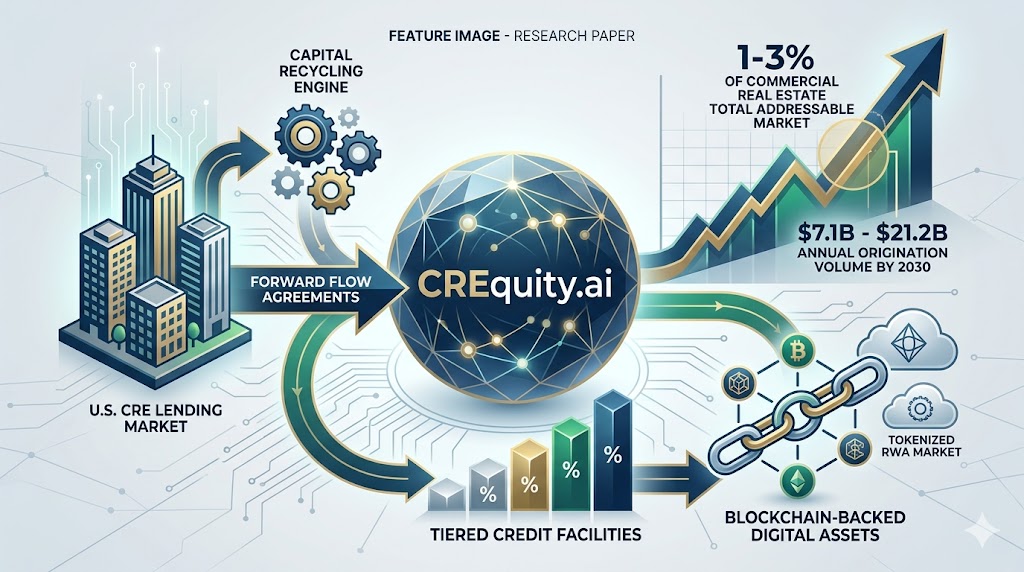
CREquity.ai: Building the Next Generation CRE Lending Infrastructure
CREquity.ai stands at the convergence of three structural megatrends:
| Market Driver | Opportunity |
|---|---|
| U.S. CRE Lending Market | $706 billion annual market recovering from its deepest correction in a decade |
| Private Credit Ecosystem | $3 trillion market displacing traditional bank lending |
| Tokenized Real-World Assets | $24+ billion market projected to reach $30 trillion by 2034 |
This report demonstrates how the Forward Flow Agreement — the “rinse and repeat” capital recycling engine — combined with:
- BTFU™ (Bridge to Finish Up)
- Tiered credit facilities
- Cooperative agreements
- Blockchain-backed digital asset infrastructure
creates a scalable origination platform capable of capturing:
CRE Market Capture Potential
| Market Share Capture | Annual Origination Volume by 2030 |
|---|---|
| 1% CRE TAM | $7.1B |
| 3% CRE TAM | $21.2B |
The probability of achieving 1% TAM capture increases from:
- 25% under organic growth alone
- 90% with the full strategy stack deployed
Table of Contents
- Market Context: The CRE Opportunity Landscape
- The Forward Flow Agreement: The “Rinse and Repeat” Engine
- BTFU™ + Forward Flow: The Scalability Flywheel
- Project Finance Risk Progression: From Acquisition to Permanent Debt
- The Blended Capital Stack: C-PACE, First Lien, and Tokenized Assets
- Total Addressable Market: CRE + Tokenization
- Tiered Credit Facility Architecture and Cooperative Agreements
- Market Share Capture: Low, Medium, and High Scenarios
- Blockchain, Digital Assets, and the AI Underwriting Advantage
- CREquity.ai Competitive Positioning and Moat Analysis
- AUM and Origination Volume Projections (2025–2030)
- Key Risks and Mitigants
- Conclusion: The Scalability Thesis
1. Market Context: The CRE Opportunity Landscape
A Historic Commercial Real Estate Lending Opportunity
The commercial real estate market in 2025 presents a structural opportunity of historic proportions.
U.S. CRE Lending Market
| Metric | Data |
|---|---|
| Total U.S. CRE lending volume (2025) | $706 billion |
| Year-over-year growth | 40% |
| Multifamily lending activity | $413 billion |
| Commercial property lending activity | $293 billion |
According to the Mortgage Bankers Association, 2025 represented the strongest annual growth rate in the current cycle.
CBRE reported that firm-originated CRE loan closings increased:
112% Year-over-Year in Q3 2025
confirming that the market recovery from the 2022–2024 correction represents a durable structural rebound.
The Structural Shift: Banks Retreat, Private Capital Expands
Beneath the market recovery lies a more significant transformation:
Traditional banks are reducing CRE lending exposure while private capital fills the gap.
CRE Lending Market Share Shift
| Year | Bank Share of CRE Loan Originations |
|---|---|
| 2022 | 50% |
| 2024 | 31% |
| Q4 2025 | Approximately 35% |
Alternative lenders accounted for:
40% of all non-agency CRE loan closings in Q4 2025
Drivers Behind the Capital Shift
The transition is driven by:
- Increased bank capital requirements under Basel III endgame rules
- Concentrated CRE exposure limits
- Unrealized losses in held-to-maturity bond portfolios
- Reduced competitiveness in transitional and value-add CRE lending
The CRE Debt Maturity Wall
A major refinancing opportunity is emerging from the:
$4+ Trillion CRE Debt Maturity Wall
These loans originated during the 2010–2022 period of historically low interest rates and now require refinancing at current market conditions.
| Period | CRE Loan Maturities |
|---|---|
| 2025 | $957 billion |
| 2026 | $1.4–$1.8 trillion projected |
| 2025–2029 Cycle | $4+ trillion |
This creates approximately:
$1.3 Trillion Annual Refinancing Demand
that must be absorbed by the market.
CREquity.ai Strategic Opportunity
For CREquity.ai — with:
- AI-powered underwriting
- 4-hour initial approvals
- 24–48 hour funding capability
- Blockchain-based tokenized settlement infrastructure
this environment represents a significant origination opportunity.
The strategic question is not whether the market exists.
The question is:
Whether CREquity.ai has the capital architecture, product design, and strategic partnerships required to capture meaningful market share.
This report demonstrates how.
2. The Forward Flow Agreement: The “Rinse and Repeat” Engine
2.1 Definition and Mechanics
The Forward Flow Agreement (FFA) is the primary capital instrument enabling private CRE lenders to scale origination volume without proportional balance sheet expansion.
A forward flow arrangement is a standing agreement where:
- A third-party investor or fund commits to purchase newly originated loans
- Purchases occur on a rolling, programmatic basis
- Eligibility criteria and pricing terms are predefined
Forward Flow Operating Model
Traditional Model
Originate → Hold Loan → Require Additional Capital → Limited Growth
Forward Flow Model
Originate → Sell Loan → Recycle Capital → Originate Again
Unlike a one-time bulk loan sale, forward flow creates a continuous institutional pipeline.
Loans move from CREquity.ai’s origination platform to the investor portfolio shortly after closing through:
- Negotiated purchase pricing
- Defined eligibility standards
- Structured downside protections
Market Validation
Private credit investors committed approximately:
$27 Billion
through forward flow origination partnerships during the 12 months through mid-2025.
This confirms forward flow as an institutional capital deployment mechanism.
Forward Flow Agreement Structure
1. Discounted Purchases
Loan pools are typically purchased at:
97–99 cents on the dollar
Benefits:
- Investor receives immediate credit protection
- Originator receives near-par liquidity
2. Deferred Purchase Price (DPP)
An additional:
1–3% of principal
is retained in reserve.
Released based on:
- Pool performance
- Agreed metrics
- Credit outcomes
3. Bounded Recourse Bands
Loss-sharing structures define:
- Investor loss absorption thresholds
- Originator participation beyond defined limits
This aligns incentives while avoiding full credit retention.
4. Cash Reserves
Automatically funded reserves protect investors by:
- Covering potential losses
- Responding to delinquency triggers
- Providing early warning indicators
5. Yield Maintenance / IRR Floors
If portfolio returns fall below agreed thresholds:
- Capped make-whole provisions protect investor returns
- Institutional return targets remain protected
6. Securitization-Grade Documentation
Forward flow structures include:
- Eligibility criteria
- Concentration limits
- Verification controls
- Documentation standards
allowing future:
- Securitization
- Syndication
- Institutional distribution
2.2 Why Forward Flow Is Paramount for CREquity.ai
Without forward flow:
- Origination capacity is limited by balance sheet size
- Growth depends on raising additional equity capital
With forward flow:
- Loans are immediately sold
- Capital is recycled
- Origination capacity becomes scalable
The “Rinse and Repeat” Capital Cycle
Originate → Tokenize → Sell via Forward Flow → Redeploy Capital → Originate Again
Each cycle generates:
- Origination fee income
- Servicing income
- Performance-based reserves
while:
- CREquity.ai expands lending capacity
- Investors earn credit spread returns
Balance Sheet Advantage
Properly structured forward flow arrangements can allow assets sold at origination to be derecognized from the originator’s balance sheet.
This enables:
- Higher origination velocity
- Reduced balance sheet constraints
- Lower dependence on equity capital formation
Forward Flow Growth Impact
| Growth Strategy | Quarterly Origination Growth |
|---|---|
| Organic growth only | ~$45M Q1 2025 → $110M Q4 2027 |
| Forward flow capital recycling | ~$542M quarterly volume by Q4 2027 |
The difference is not additional equity capital.
It is:
Capital Velocity
enabled by forward flow infrastructure.
2.3 Forward Flow vs. Alternative Capital Structures
| Capital Instrument | Primary Function | Balance Sheet Impact | Scalability | Cost of Capital |
|---|---|---|---|---|
| Forward Flow Agreement | Programmatic loan sale / capital recycling | Derecognized (off-balance sheet) | Very High | 8.5% all-in |
| Warehouse Line of Credit | Short-term funding bridge | On-balance sheet | High | 7.0% all-in |
| Co-Investment / Cooperative | Shared risk / shared return | Partial on-balance sheet | Medium-High | 9.0% all-in |
| CRE CLO / Securitization | Capital markets exit | Derecognized | Very High | 7.5% all-in |
| Tokenized Digital Asset Facility | Digital collateral financing | Partial on-balance sheet | High | 9.5% all-in |
The Forward Flow Agreement remains the cornerstone of CREquity.ai’s capital architecture due to its:
- Off-balance sheet potential
- Programmatic scalability
- Institutional-grade documentation
3. BTFU™ + Forward Flow: The Scalability Flywheel
3.1 The BTFU™ Product Architecture
The Bridge to Finish Up (BTFU™) program is CREquity.ai’s signature product and the primary engine of its forward flow strategy.
BTFU™ is structured as a two-phase financing solution:
| Phase | Structure |
|---|---|
| Phase 1 | 24-month bridge loan |
| Loan-to-value | Up to 70% LTV |
| Phase 2 | 36-month stabilization period |
| Total lifecycle | 60 months |
Additional capability:
- Up to 25% equity placement
providing borrowers with a complete capital solution from:
Acquisition → Renovation → Stabilization
Why BTFU™ Fits Forward Flow
BTFU™ is designed specifically for the value-add CRE segment.
Key characteristics:
- Standardized eligibility criteria
- Defined LTV thresholds
- Property type parameters
- Market concentration limits
- Borrower qualification standards
Institutional Investor Fit
BTFU™ provides:
- Predictable loan lifecycle
- Diversified seasoning profile
- Risk-adjusted returns aligned with private credit expectations
Return profile:
| Stage | Yield Range |
|---|---|
| Origination | 9–13% |
| Stabilization | 7–10% |
The CREquity.ai Scalability Flywheel
BTFU™ Loan Origination
↓
Forward Flow Sale
↓
Capital Recycling
↓
New Loan Origination
↓
Larger Institutional Track Record
↓
Improved Capital Terms
3.3 The “Rinse and Repeat” Cycle in Practice
Example:
CREquity.ai originates:
$5 million BTFU™ bridge loan
for a:
50-unit multifamily value-add acquisition in Atlanta
Structure:
| Item | Amount |
|---|---|
| Loan amount | $5M |
| Property value | $7.7M |
| LTV | 65% |
| Interest rate | 10.5% interest-only |
| Term | 24 months |
Within 72 hours:
Loan sold to forward flow investor at:
98.5 cents on the dollar
Investor purchase:
$4.925 million
Deferred purchase price reserve:
1.5%
Capital Recycling Impact
CREquity.ai:
- Receives liquidity
- Retains servicing rights
- Earns servicing fees
- Deploys recycled capital into new originations
Annual Capital Velocity Example
Assumptions:
| Metric | Value |
|---|---|
| Capital base | $50M |
| Average loan size | $5M |
| Average hold period | 90 days |
| Annual cycles | 4 |
Annual origination capacity:
$200M
Fee generation:
| Revenue Source | Amount |
|---|---|
| Origination fee (1.5%) | Included |
| Servicing fee (0.625%) | Included |
| Annual fee income | ~$4.25M |
Return on capital from fees alone:
8.5%
before considering:
- Credit spread
- Equity participation
- Additional platform revenue